regular
Card 6 of 9
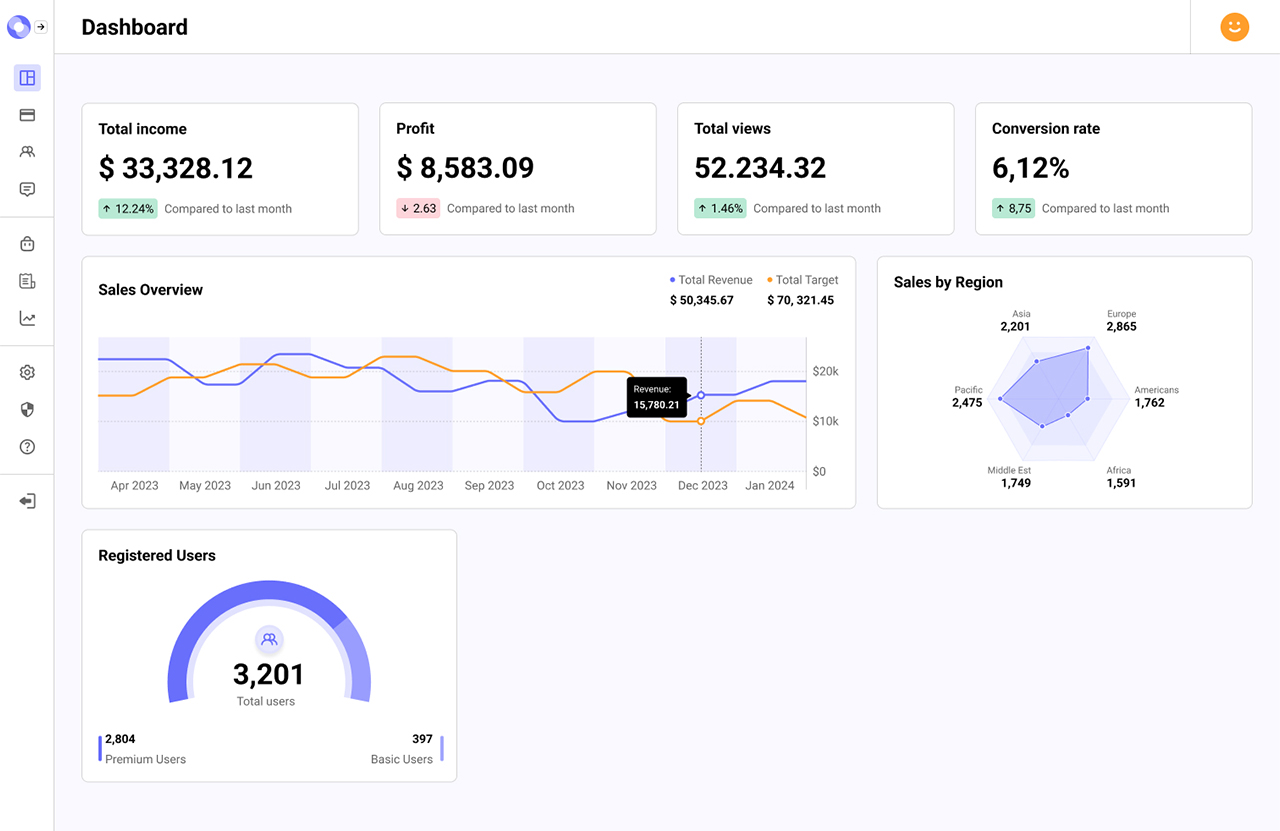
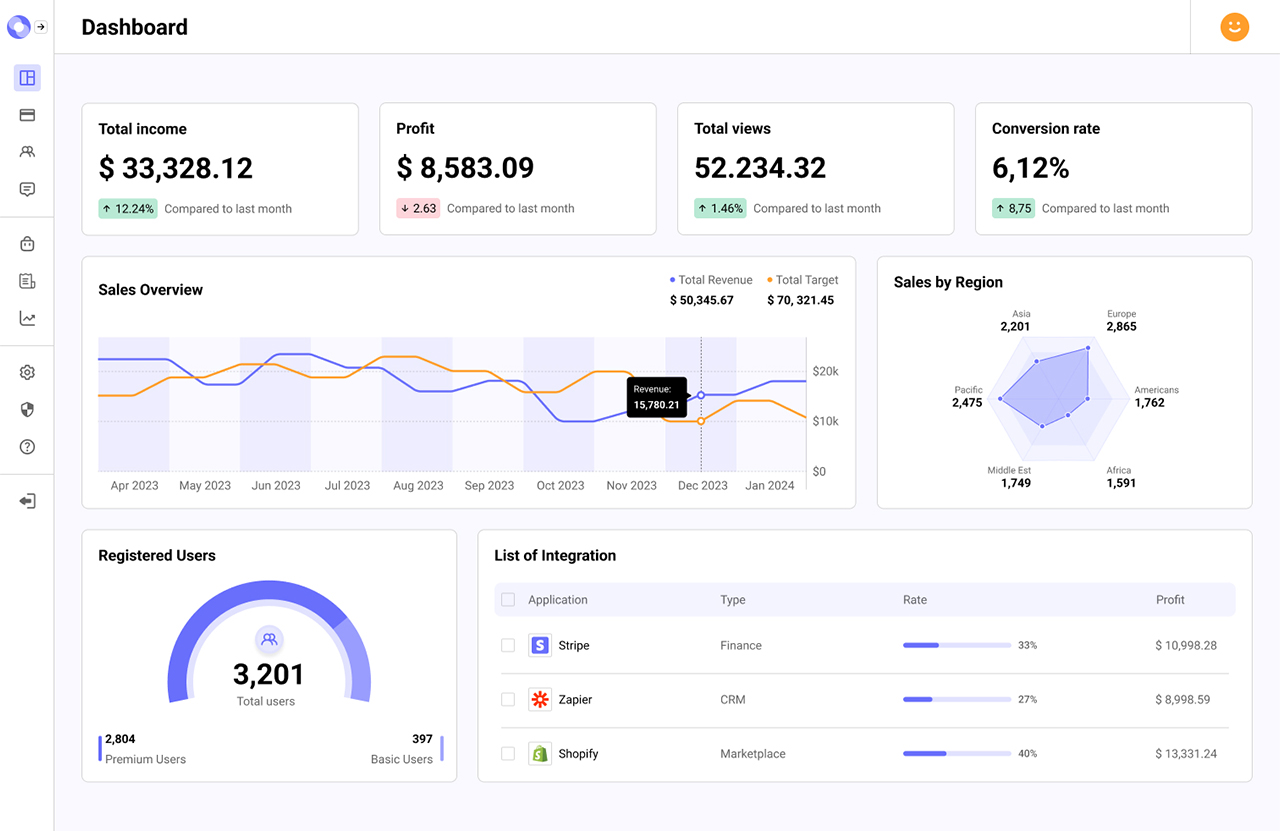
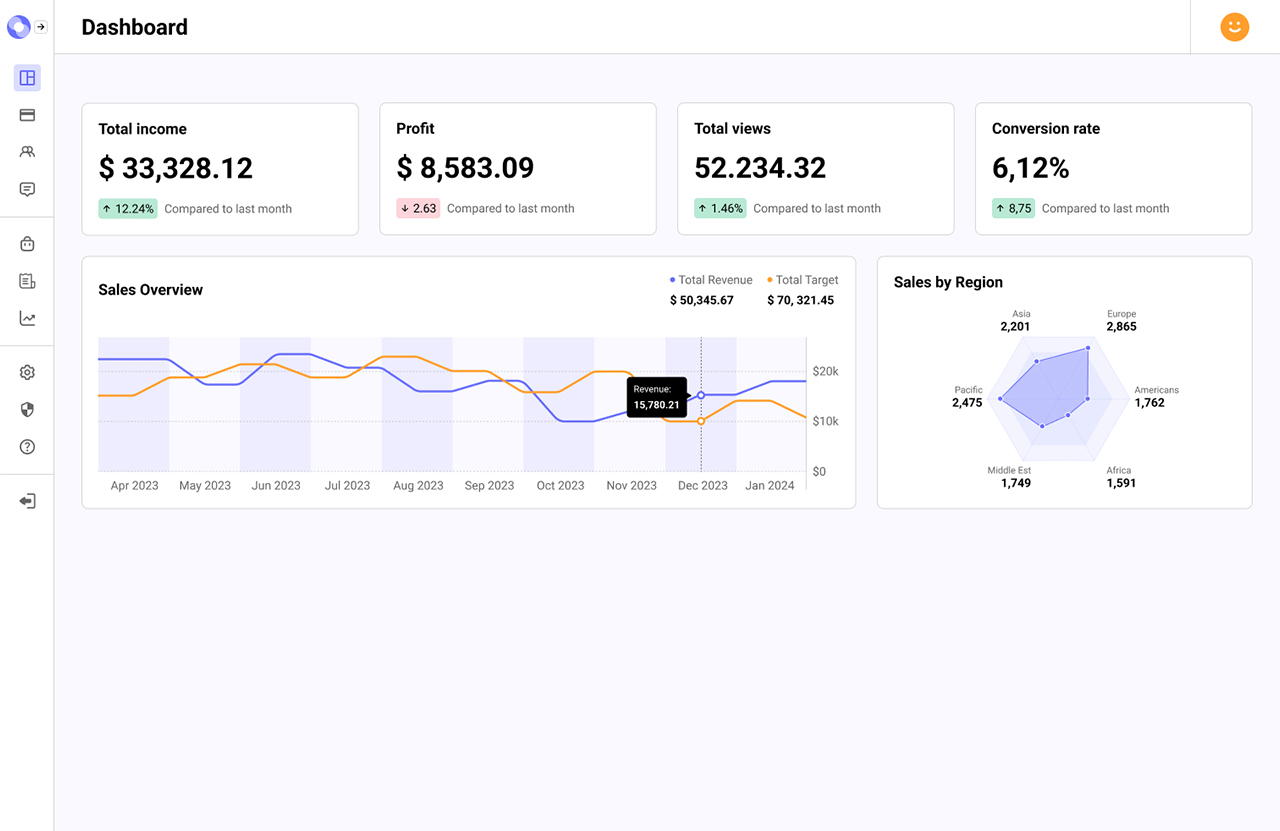
Sales Region Chart
User story
As a User, I want a "Sales by Region" radar chart within a card to visualize data by continent, allowing me to quickly grasp the sales distribution across different regions.
Acceptance criteria
- Feature a "Sales by Region" radar chart in a card for visualizing sales data by continent.
- Ensure the chart is interactive and user-friendly.
- Recommend and utilize a JavaScript charting library that supports radar charts.
Build this task card
Start your 7-day free trial to build this card in our code editor with Figma designs and live preview.
Start 7-Day Free Trial to Build This Card