senior
Card 5 of 9
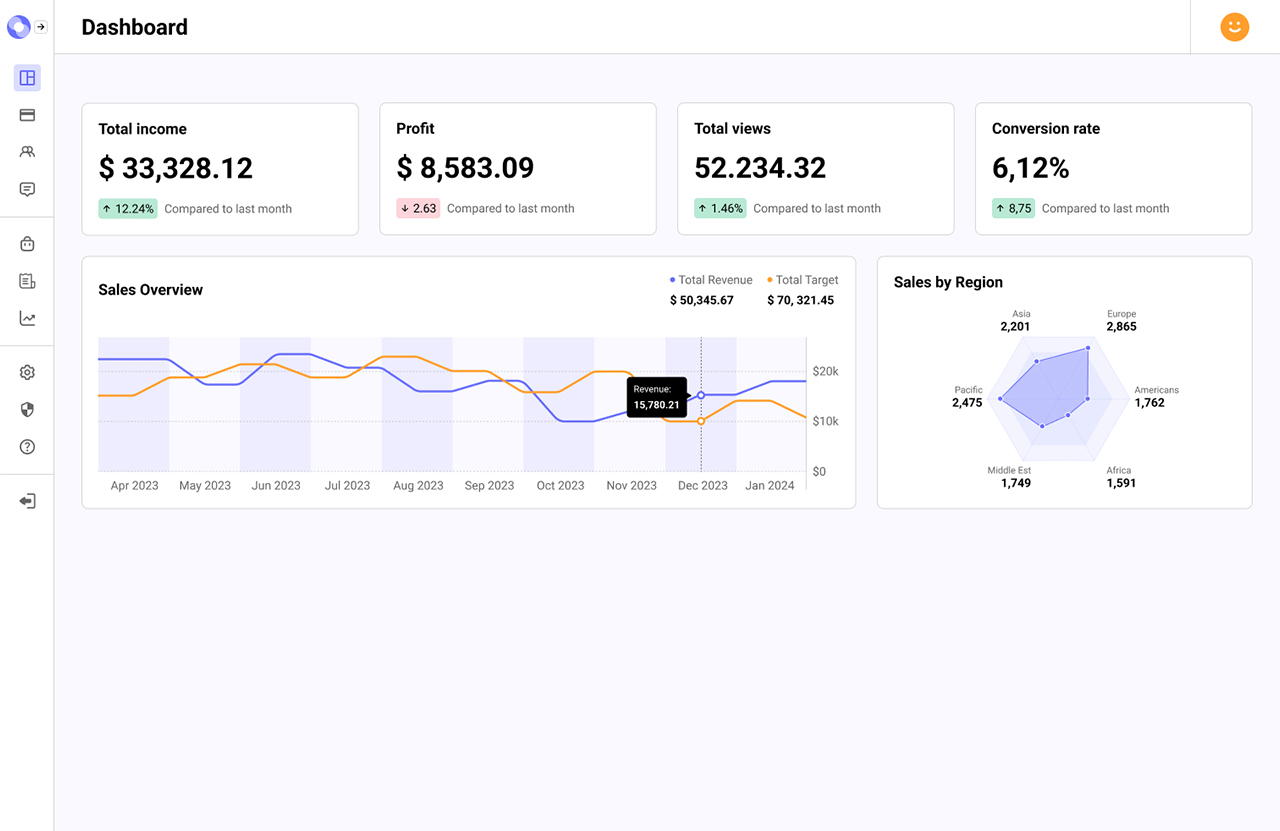
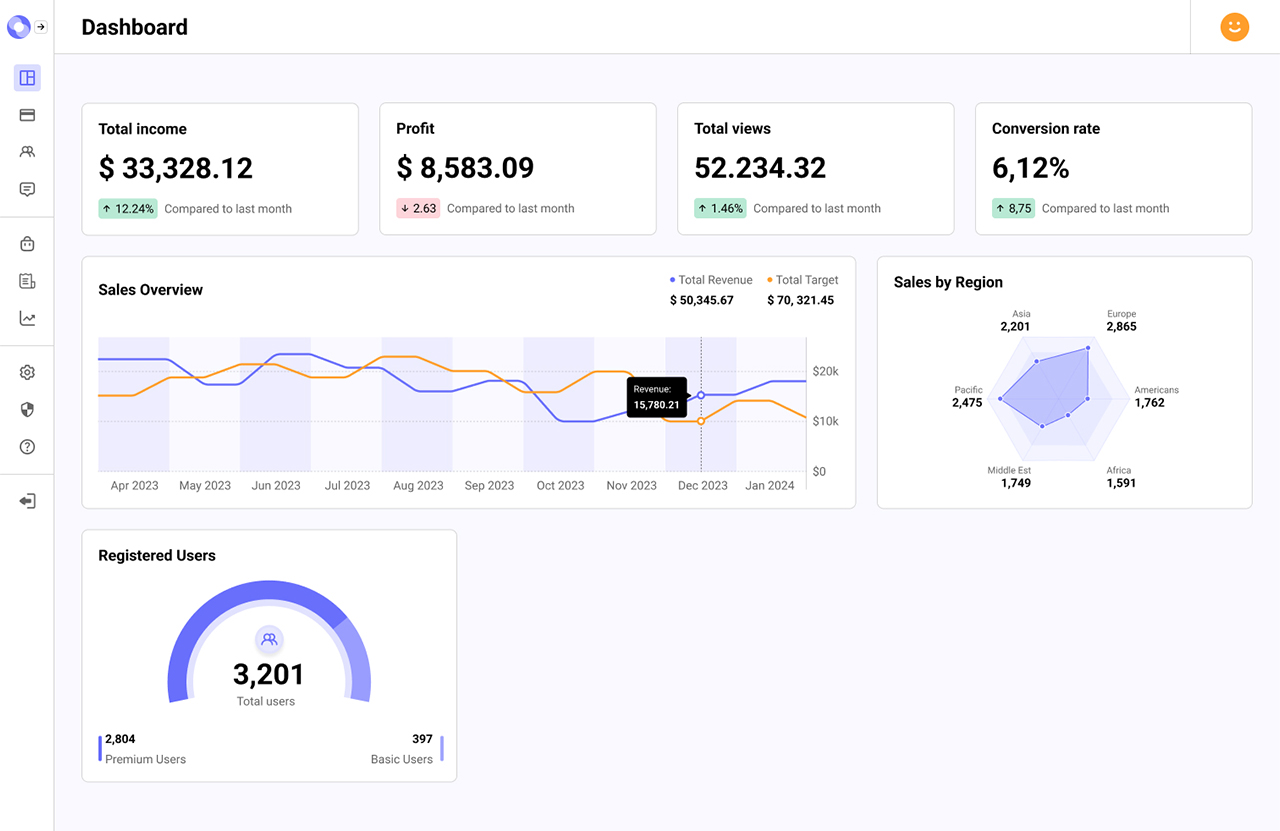
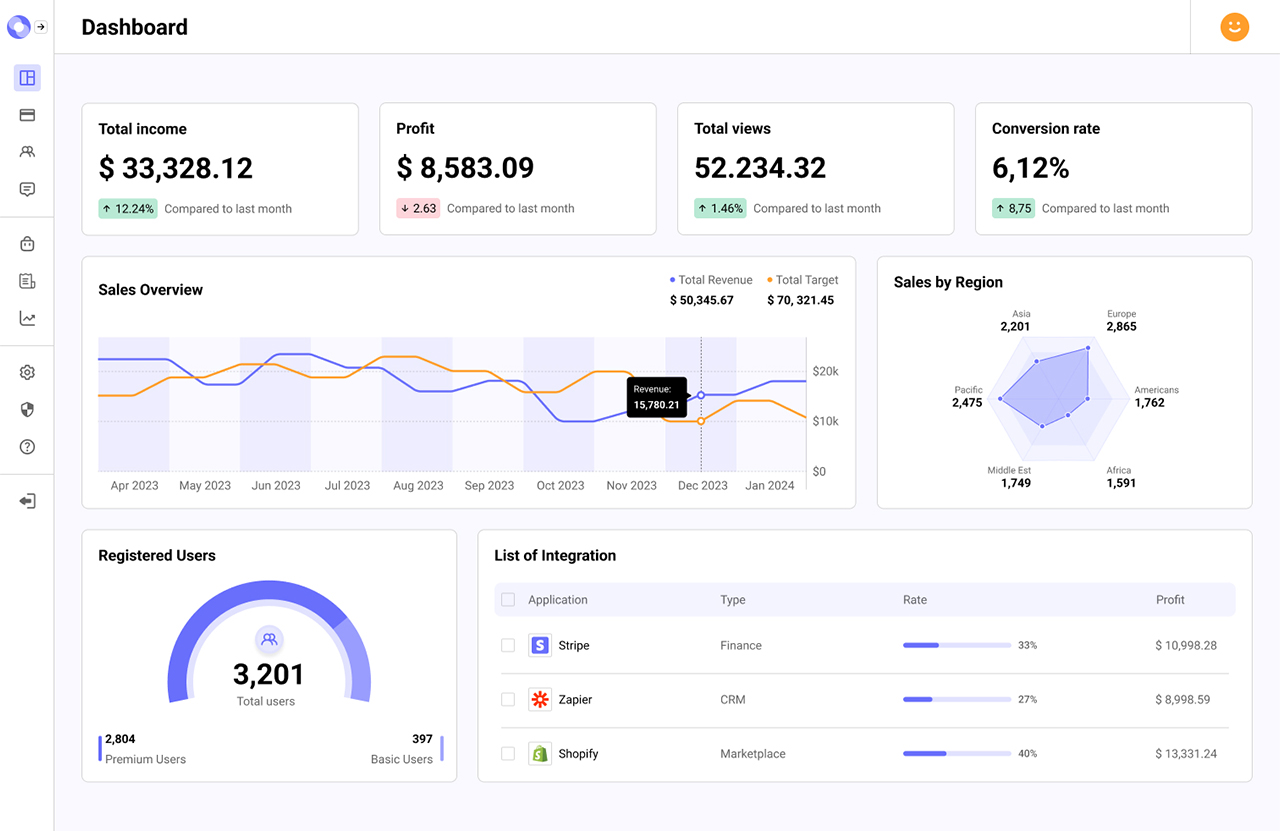
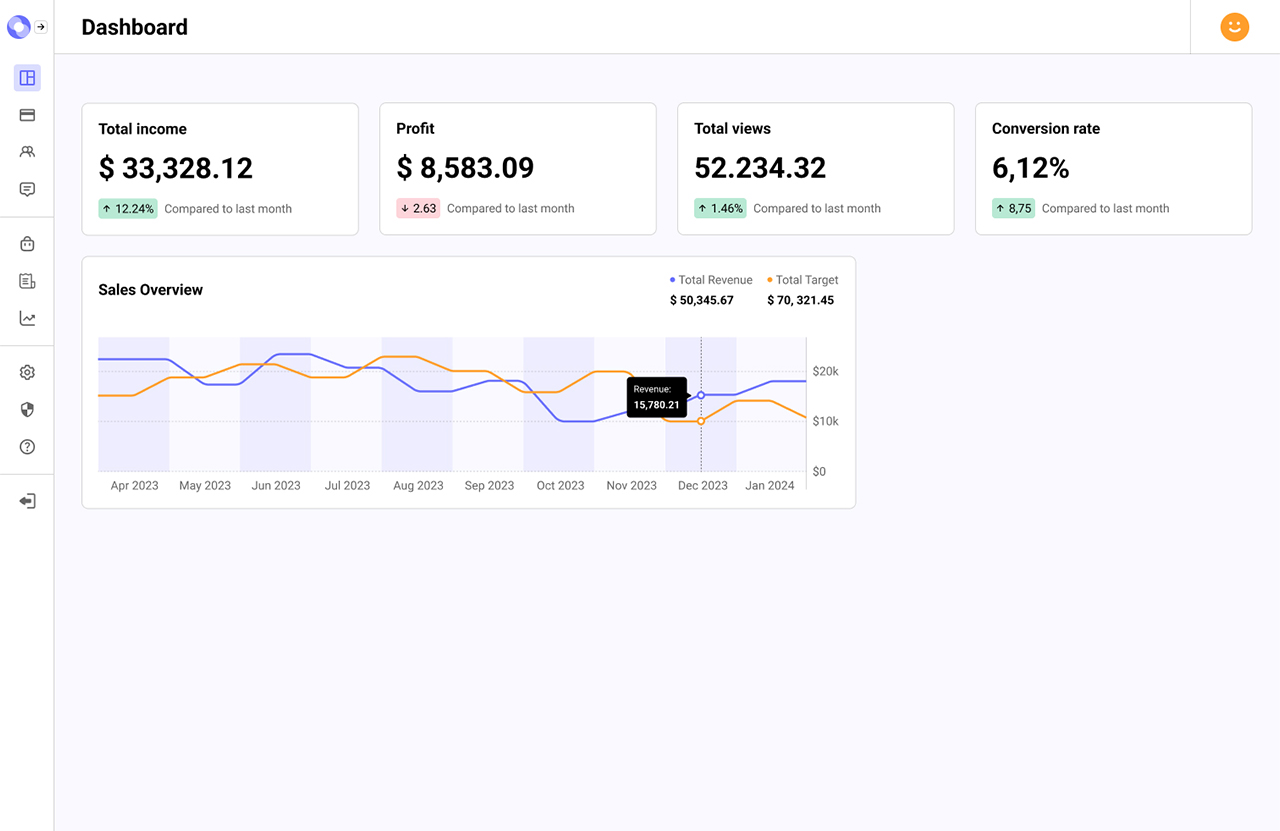
Sales Overview Chart
User story
As a User, I want a "Sales Overview" line chart within a card that includes hover effects over data points and compares two data sets across a timeline, for a detailed analysis of sales performance.
Acceptance criteria
- Integrate a "Sales Overview" line chart in a card.
- The chart should include hover effects and compare two data sets.
- Label the axes appropriately for easy understanding.
- Find and use a JavaScript charting library capable of creating this chart.
Build this task card
Start your 7-day free trial to build this card in our code editor with Figma designs and live preview.
Start 7-Day Free Trial to Build This Card