Day 31 Beginner
Challenge 31 of 100
Dashboard
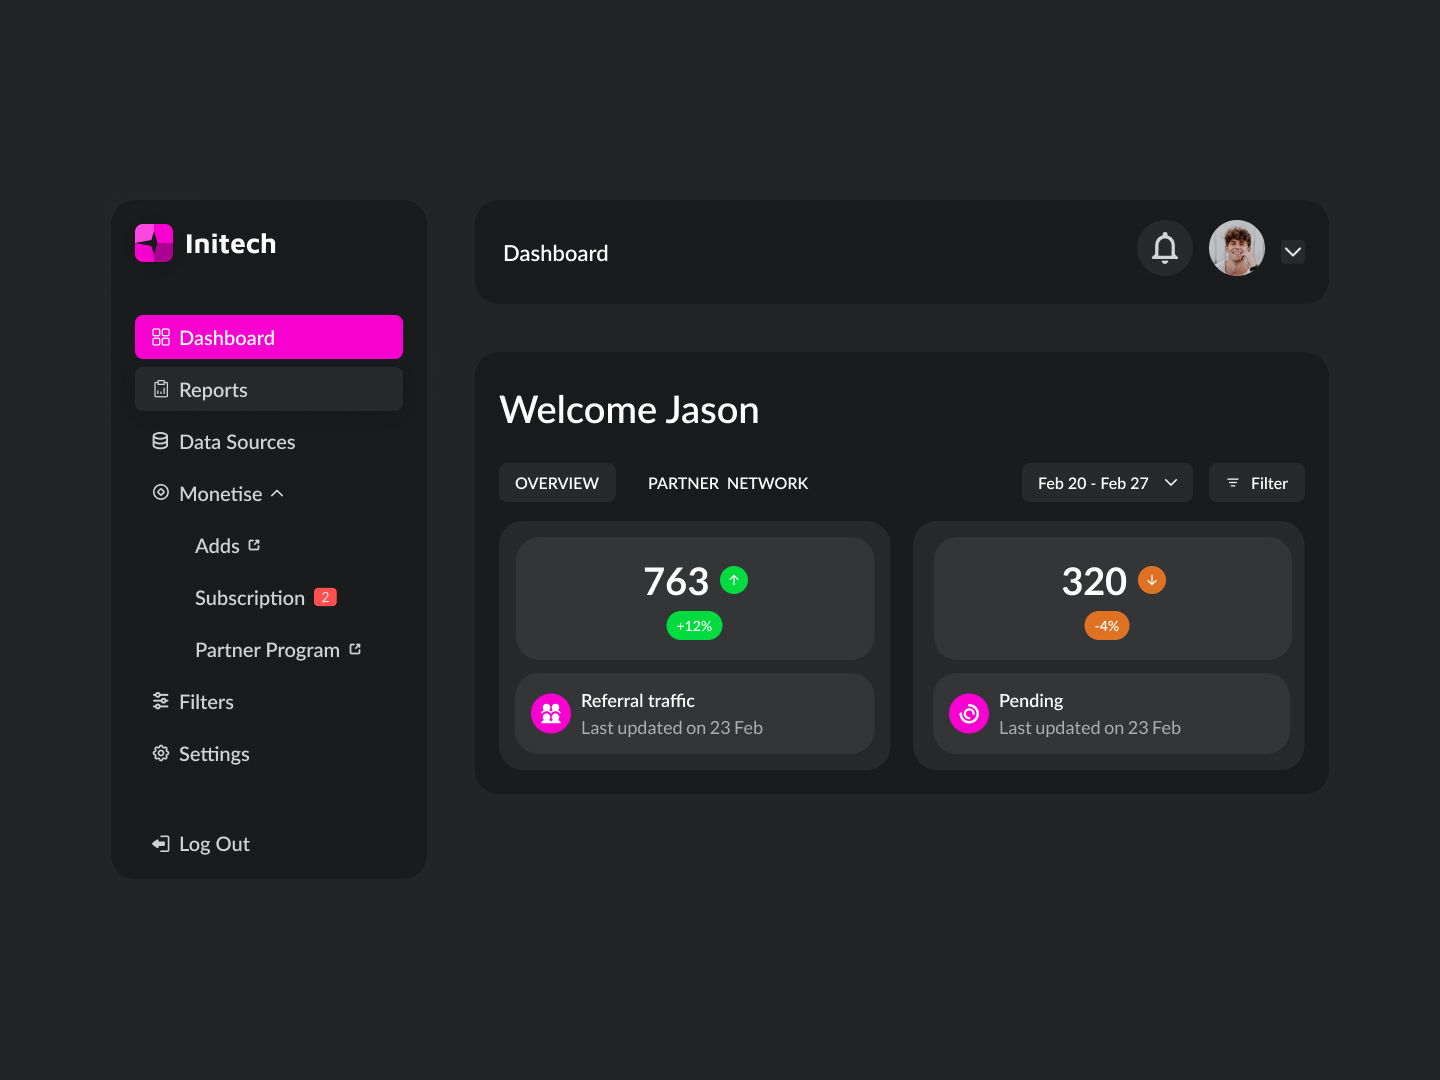
As a business analyst or manager, I need a comprehensive and intuitive business dashboard that allows me to quickly view key performance metrics, manage subscriptions, and monitor referral traffic, enabling me to make informed decisions and track business growth effectively.
Acceptance Criteria
- ✓ The dashboard must offer a clear welcome message with the user's name to provide a personalized experience.
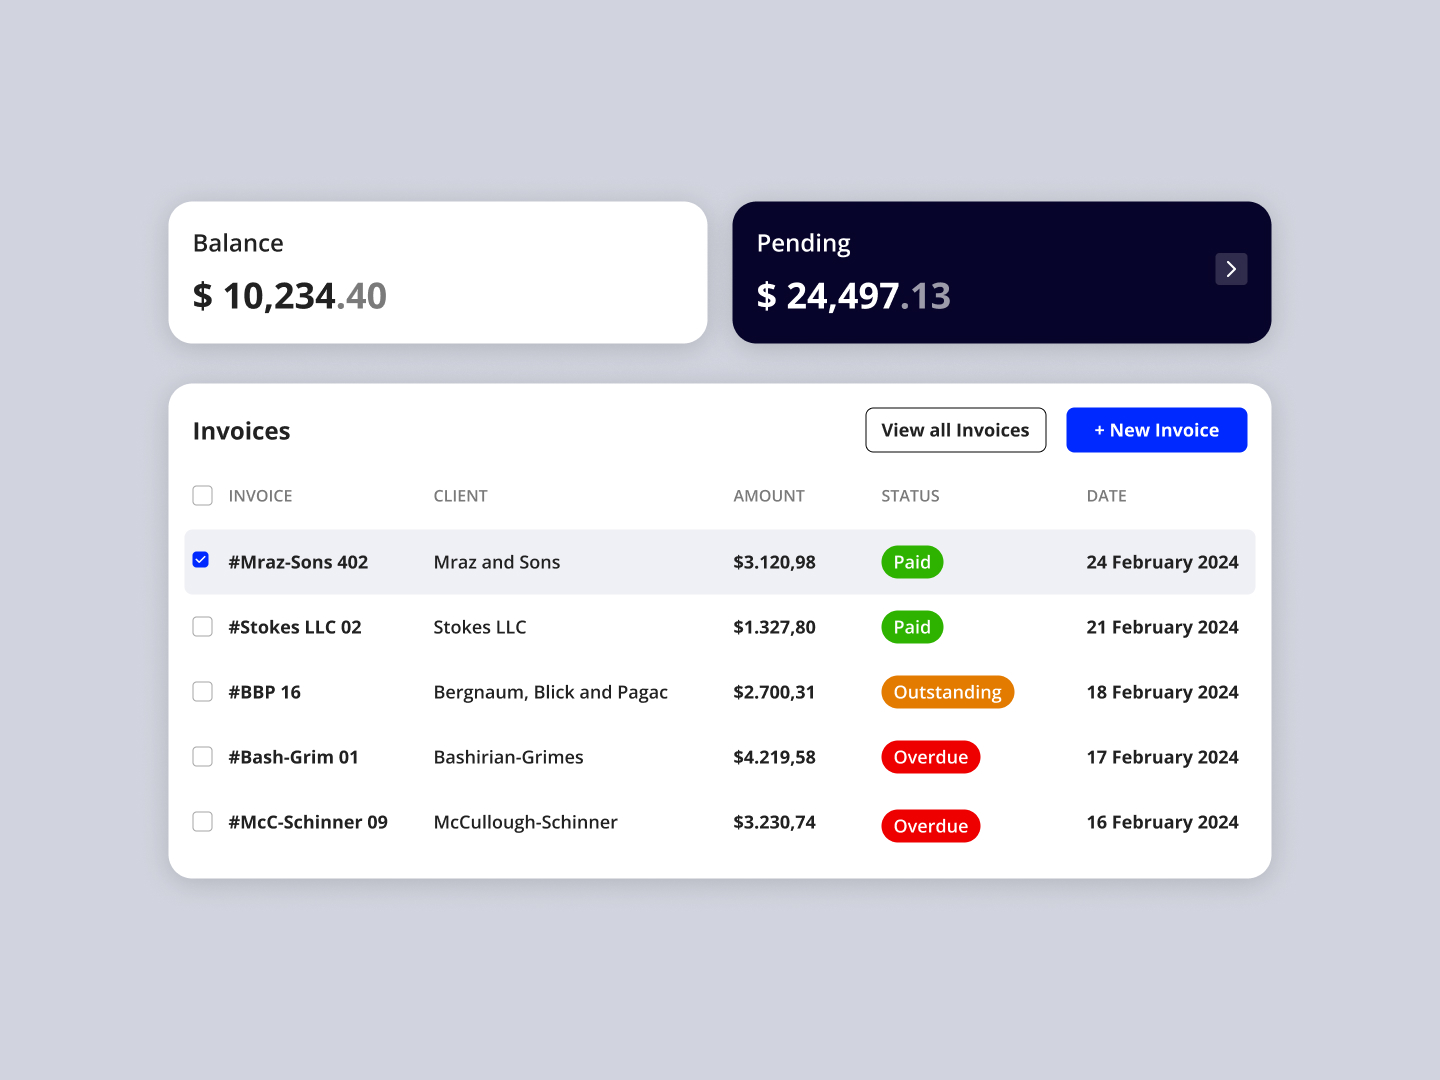
- ✓ Key performance metrics such as total partners, pending tasks, and referral traffic should be prominently displayed in distinct, easy-to-read modules.
- ✓ Each metric module should include visual indicators, such as percentage changes or progress bars, to provide a quick understanding of growth or decline.
- ✓ The ability to filter and adjust the date range for displayed data should be available, allowing users to customize views according to specific time frames.
- ✓ A sidebar navigation menu should include links to other important sections like Reports, Data Sources, Monetization options, and Settings for easy access to deeper functionalities of the platform.
- ✓ Notifications or alerts regarding updates or actions required (e.g., new subscription alerts or partner program updates) should be visible and easily accessible from the dashboard.
- ✓ The design should be responsive, ensuring that the dashboard is equally usable on desktops, tablets, and mobile devices, with a consistent user interface across all platforms.
100 Days of Code Progress Day 31 / 100
Take this challenge
Start your 7-day free trial to solve this challenge in our built-in code editor with live preview.
Start 7-Day Free Trial to Solve This Challenge